A hostname that never existed took Redis and Postgres down with it
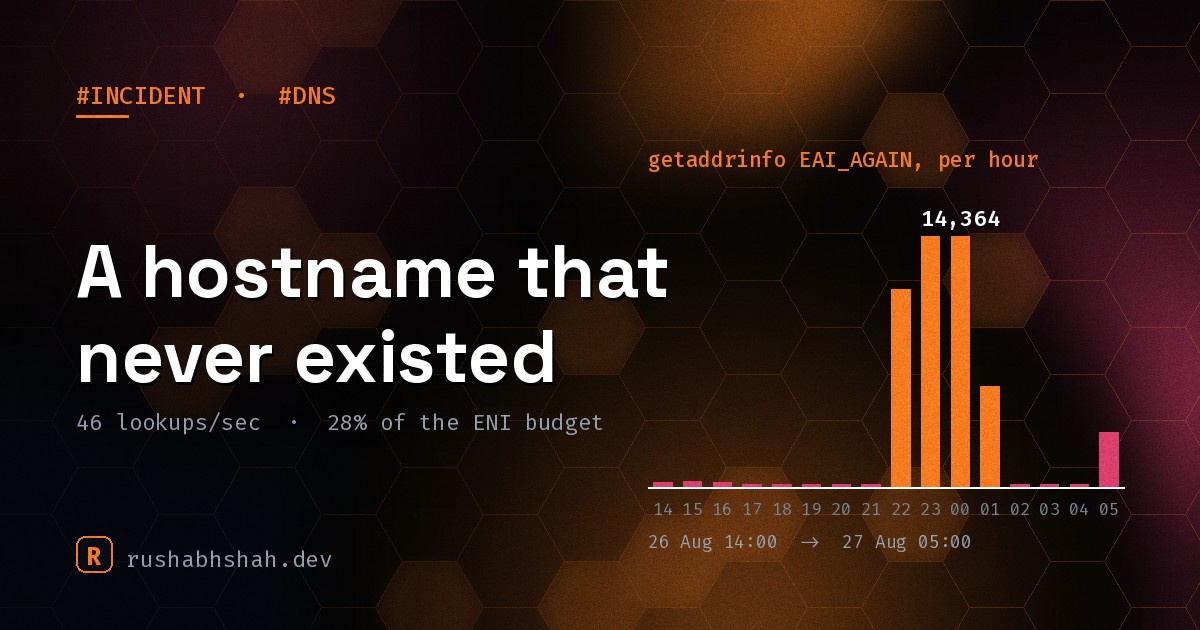
The report was "Redis keeps dropping on the dev box."
That sentence is a trap, and I walked into it for about twenty minutes. It points at Redis. It has a subject and a verb and a thing to go and look at, so you go and look at Redis, and Redis is fine. It answers on demand, twenty probes out of twenty, no packet loss, no memory pressure, no eviction. Then you look at the service doing the complaining and it is fine too. Then you notice the same error against Postgres, which is a completely different box, run by a completely different managed service, on a completely different port.
Two unrelated dependencies failing the same way at the same time is not two problems. It is one problem, one layer down, and it is almost always the layer nobody drew on the architecture diagram.
In this case the layer was DNS, and the thing breaking it was a hostname that has never existed. Not a hostname that stopped existing, or that pointed at a dead box. One that was never created, that no service needed, that resolved to nothing from the day the code shipped, and that two dozen processes had been asking for, several times a second each, for weeks.
The two services that lost Redis and Postgres do not use Elasticsearch. They were never going to use Elasticsearch. They were collateral.
This is the write-up. Names and hostnames are generalised, the numbers are exactly as measured.
The shape of it, before the detail
If you close this tab now, take these:
| What | Number |
|---|---|
| Services asking for a hostname that does not exist | 24 |
| DNS lookups per second, sustained | 46 |
| Packets per second leaving the box for those lookups | 282 |
| Share of all DNS leaving the box that was for two dead names | 99.4% |
| AWS per-ENI DNS limit, above which packets are silently dropped | 1,024 pps |
| Share of that budget burnt on nothing | ~28% |
EAI_AGAIN failures in the worst three-hour window |
~45,000 |
| Services affected that do not use the failing dependency | 2 |
| Lines of code that were wrong | roughly 1 |
The last row is the one worth sitting with. Nothing here is exotic. There is no kernel bug, no AWS incident, no clever exploit. A string was built from an environment variable, the resulting name was never registered, and the client retried forever instead of giving up.
Where a DNS lookup actually goes
Most of us carry a mental model of DNS that stops at "the app asks for a name and gets an address." That model has no failure modes in it, which is why it is useless during an incident. Here is the version with the failure mode in it.
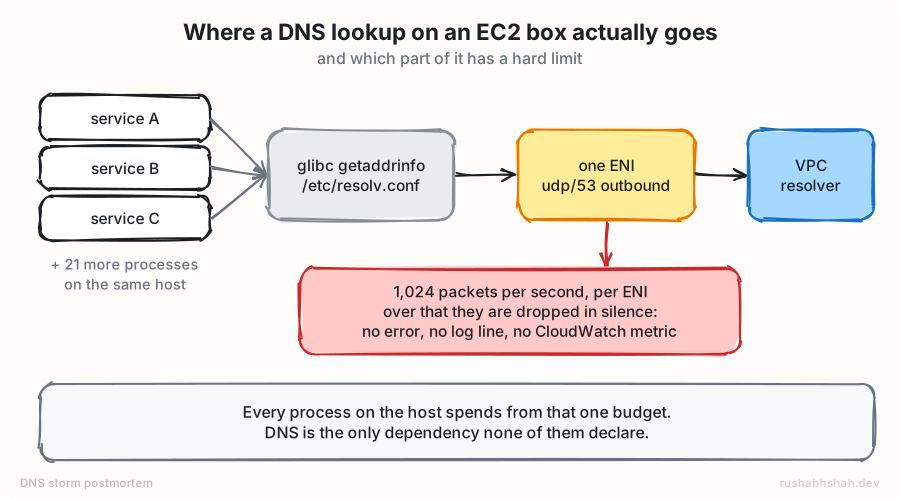
Three things in that picture matter and two of them are usually invisible.
The resolver is shared per host, not per process. Your service does not have its own DNS. It calls getaddrinfo, glibc reads /etc/resolv.conf, and the query goes out of the instance's network interface to the VPC resolver at the .2 address of your VPC's CIDR. Every process on the box uses the same path.
That path has a hard limit. AWS enforces 1,024 packets per second per network interface to the Route 53 Resolver. Not per process, not per account. Per ENI.
Above the limit, packets are dropped in silence. No error is returned. No log line is written. There is no CloudWatch metric for it, because the drop happens in the network fabric and not in anything you own. From inside the box, an exceeded DNS quota and a slow upstream look identical: your query goes out and nothing comes back.
That last property is why this class of failure survives so long. The system has no way to tell you that it is throttling you, so the only symptom is other things failing for reasons that make no sense.
The name that was never created
The application logger built its endpoint out of the environment:
// the shape of it, reduced to the part that mattered
const host = `logs-${process.env.NODE_ENV}.example.internal`;
NODE_ENV was development on 22 services and dev on two more, so this produced two hostnames. Neither had ever been registered.
The equivalent name for the UAT environment resolved fine, which is the detail that tells you what actually happened: nobody deleted the record, and nothing regressed. When the environment was set up, a record was created for one environment and simply never created for the other. The code shipped, the logger failed, the failure was caught and logged, and everybody moved on for months.
Confirming it takes one command, and the answer is more specific than "it does not resolve":
dig logs-development.example.internal +noall +answer +authority

# example.internal. 60 IN SOA ns-513.awsdns-00.net. ...
An answer section with nothing in it, and an authority section with the zone's SOA, is NODATA: the zone exists, the name does not have the record type you asked for. That is different from NXDOMAIN, where the name does not exist at all. Node surfaces both as ENOTFOUND, which is where the distinction usually gets lost.
The name is also worth checking on disk before you believe any of this, because a hostname built at runtime will not appear in the config you would normally grep:
# nothing. the name never exists as a literal anywhere
grep -r "logs-" /srv/services/*/.env

# only the credentials for it do, which is its own smell:
# ELASTIC_LOG_USERNAME=...
# ELASTIC_LOG_PASSWORD=...
Credentials for an endpoint whose address is assembled from an environment variable at startup. That combination is worth a second look in any codebase, because it means no static analysis, no config review, and no infra plan will ever show you the thing being connected to.
Every lookup left the box twice
Once I started capturing the actual traffic, the counts were strange in a specific way: every hostname appeared exactly twice, with identical query counts.
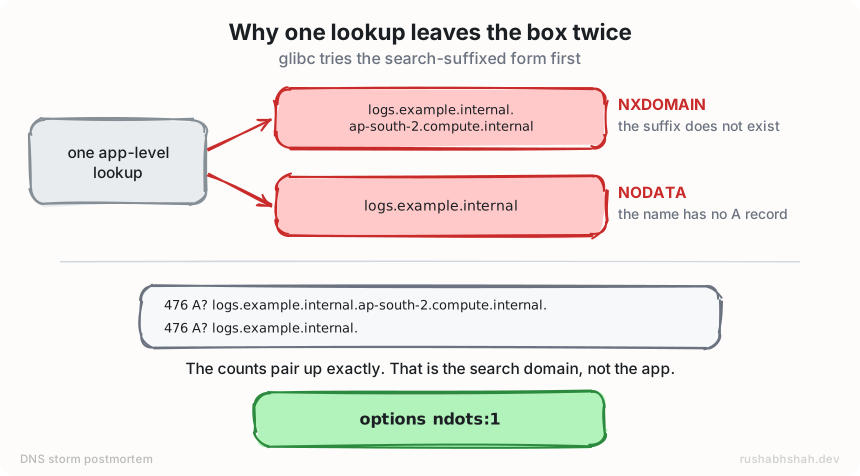
/etc/resolv.conf on an EC2 instance carries a search domain:
search ap-south-2.compute.internal
options timeout:2 attempts:5
nameserver 172.31.0.2
glibc's ndots default is 1, which sounds like it should protect you, and for a dotted name it does exactly the wrong thing anyway: with fewer than ndots dots the search list is tried first, and even above the threshold glibc will fall back through the search list after the absolute query fails. Here the absolute name returned NODATA rather than a usable answer, so the resolver kept doing both.
The result: one application-level lookup cost two upstream queries. Every retry loop in the system was quietly running at double the rate its author intended, which is worth knowing even when nothing is broken. It is also why dig "looks fine" while tcpdump looks insane. dig sends the absolute name once. Your application does not.
282 packets a second, forever
Thirty seconds of capture, filtered to queries leaving for the VPC resolver:
sudo timeout 30 tcpdump -i ens5 -nn \
  'udp port 53 and dst host 172.31.0.2' > /tmp/dns_up.txt

grep -oE 'A\? [a-zA-Z0-9._-]+' /tmp/dns_up.txt \
  | sort | uniq -c | sort -rn
total upstream queries in 30s: 1380

476  A? logs-development.example.internal.ap-south-2.compute.internal.
476  A? logs-development.example.internal.
208  A? logs-dev.example.internal.ap-south-2.compute.internal.
208  A? logs-dev.example.internal.
  3  A? ssmmessages.ap-south-2.amazonaws.com.
  3  A? secretsmanager.ap-south-2.amazonaws.com.
  2  A? ip-172-31-43-112.ap-south-2.compute.internal.
  1  A? android.clients.google.com.
99.4% of all DNS leaving this machine was for two hostnames that do not exist. The remaining 0.6% is everything the box actually does.
Packet rate, measured rather than inferred:
sudo timeout 10 tcpdump -i ens5 -nn 'udp port 53' | wc -l
# 2819   ->  282 packets/sec
282 against a ceiling of 1,024. About 28% of the interface's entire DNS budget, permanently committed to failure, with no headroom for anything bursty. A deploy that restarts every service at once, a batch job that fans out, a health check that starts resolving a name it used to cache: any of those now lands on a box that has already spent a quarter of its allowance.
Why negative caching did not save us
The obvious objection is that DNS caches negative answers, so a name that does not resolve should be asked for once and then remembered.
It does cache them. The zone's SOA record sets the negative TTL as min(SOA TTL, MINIMUM field), which here worked out to 60 seconds. In theory each of these names should be queried once a minute and nothing else.
In practice the traffic was sustained at 46 queries a second, and the reasons are worth naming because they generalise:
- There was no cache on the box. glibc does not cache DNS. Unless something is running
nscd,systemd-resolvedwith caching on, or a localdnsmasq, every singlegetaddrinfocall is a fresh query on the wire. Most Linux servers I meet have nothing in that slot, and nobody notices until it matters. - The retry loops were faster than the TTL. A client reconnecting every few seconds does not care that the last answer was 3 seconds old, because nothing is holding onto the last answer.
- Two names, two failure types. The search-suffixed form returned NXDOMAIN and the absolute form returned NODATA. Both are negatively cacheable in principle, and neither was being cached by anything in this path.
Negative caching is a property of a resolver. If there is no resolver on the host, there is no negative caching on the host, no matter what the TTL says.
The part that actually hurt
Everything above is waste. Annoying, but survivable. Here is the part that produced an actual outage.
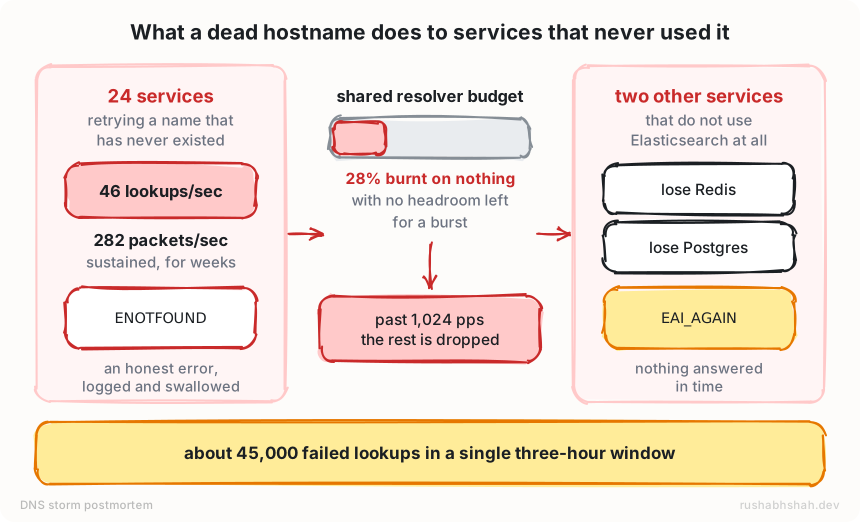
Every DNS failure recorded in the retained logs, grouped:
grep -rh "getaddrinfo" /home/*/.pm2/logs/*.log \
  | sed 's/^.*getaddrinfo/getaddrinfo/' \
  | sort | uniq -c | sort -rn
49202  getaddrinfo EAI_AGAIN  redis.internal
33030  getaddrinfo ENOTFOUND  logs-development.example.internal
 3624  getaddrinfo EAI_AGAIN  db-primary.internal
   21  getaddrinfo EAI_AGAIN  slack.com
Read that ordering carefully, because it is the whole lesson. The thing that is broken is second on the list. The top line, by a wide margin, is a completely healthy dependency failing for a reason that has nothing to do with it. Even Slack shows up, which is how you know it is not about any one service.
Bucketed by hour, the worst stretch:
| Hour | EAI_AGAIN |
|---|---|
| 26 Aug 14:00 | 4 |
| 26 Aug 15:00 | 268 |
| 26 Aug 16:00 | 75 |
| 26 Aug 22:00 | 11,287 |
| 26 Aug 23:00 | 14,362 |
| 27 Aug 00:00 | 14,364 |
| 27 Aug 01:00 | 5,711 |
| 27 Aug 05:00 | 3,063 |
About 45,000 failed lookups across three hours. The two services that absorbed nearly all of it were a job runner and a rendering worker. Neither of them has an Elasticsearch client. Neither of them was deployed that week. Neither of them changed at all. They lost Redis and Postgres because other processes on the same host had spent the interface's DNS budget on a name nobody needed.
If you have ever been handed an incident where the service that broke has no recent commits, no config change and no dependency on anything that did change, this is the shape of thing to go looking for.
ENOTFOUND, EAI_AGAIN, ECONNREFUSED
The single most useful thing I took out of this is that these three are not variations on "the network is bad." They are three different problems with three different owners, and the log line tells you which one you have if you read the code instead of the hostname.
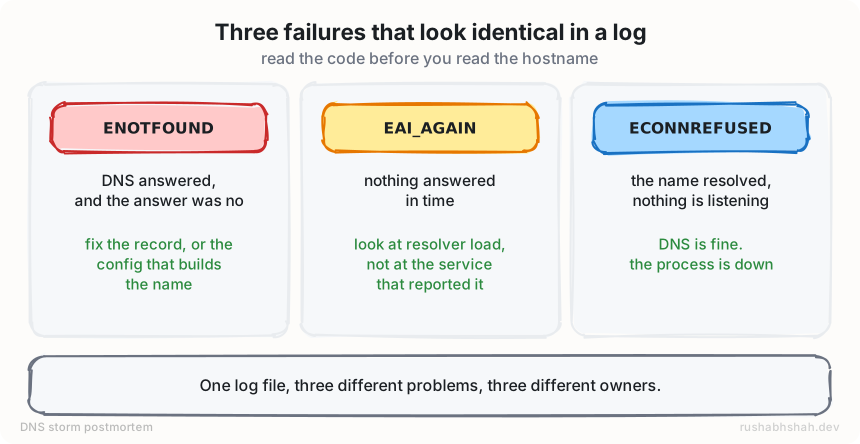
ENOTFOUND means DNS answered and the answer was no. The resolver worked. Somebody either did not create a record, or the code built the wrong name. This is a config bug, and it is honest: it fails immediately and says exactly what it was looking for.
EAI_AGAIN means nothing came back in time. It is a temporary failure. Crucially, it says nothing at all about the hostname in the message. The name in an EAI_AGAIN line is a victim, not a suspect. Chasing it sends you to Redis, or RDS, or Slack, which is exactly what happened here and exactly what it is designed to make you do. When you see EAI_AGAIN against several unrelated names at once, stop looking at the names and go and measure your resolver.
ECONNREFUSED means the name resolved fine and there is nothing listening on the other end. DNS is not your problem. A process is down, or a security group is wrong.
One log file, three teams.
Why nginx showed nothing
"Did you check nginx?" is the first question anybody asks, and it is worth answering properly because the answer is structural rather than incidental.
nginx on this box is a reverse proxy for inbound HTTP, forwarding to 127.0.0.1:<port>. The failing lookups are outbound DNS from application processes to Elasticsearch, Redis and Postgres. That traffic never touches nginx at any point, so nginx cannot see it, cannot log it, and would not have alerted on it. Confirmed rather than assumed:
grep -icE "could not be resolved|Temporary failure|no live upstreams" \
  /var/log/nginx/error.log
# 0
nginx only performs its own DNS resolution when a proxy_pass target is built from a variable and a resolver directive is set. Static upstreams are resolved once at config load.
The errors that were in the nginx log turned out to be a completely different bug: 4,733 connect() failed (111: Connection refused), 99.9% of them against a single upstream port, which was a service stuck in a crash loop on an unrelated IAM permission. Real, worth fixing, and nothing to do with any of this. Worth stating out loud so the two never get merged in someone's head: "connection refused" means the app is not listening. EAI_AGAIN means DNS did not answer.
The other thing the nginx logs were good for: 93% of all requests to that box were health checks. Which is its own post.
Check your own box in five minutes
None of this needs a maintenance window and all of it is read-only.
1. What is your box actually asking for?
sudo timeout 30 tcpdump -i "$(ip route get 1.1.1.1 \
  | grep -oP 'dev \K\S+')" -nn 'udp port 53' > /tmp/dns.txt

grep -oE 'A+\? [a-zA-Z0-9._-]+' /tmp/dns.txt \
  | sort | uniq -c | sort -rn | head -20
If anything in the top five is a name you do not recognise, or the same name appears twice with matching counts, you have found something.
2. How close to the ceiling are you?
sudo timeout 10 tcpdump -i ens5 -nn 'udp port 53' | wc -l
# divide by 10. The limit is 1,024 packets/sec per ENI.
Anything sustained above roughly 300 pps on an idle box deserves an explanation.
3. Is anything already failing this way?
grep -rhoE "getaddrinfo (EAI_AGAIN|ENOTFOUND) [a-zA-Z0-9._-]+" \
  /var/log /home/*/.pm2/logs 2>/dev/null \
  | sort | uniq -c | sort -rn | head
EAI_AGAIN against two or more unrelated hostnames is the signature. One name is a coincidence. Three is a resolver.
4. Do you have a cache at all?
grep -E '^(nameserver|search|options)' /etc/resolv.conf
systemctl is-active nscd systemd-resolved 2>/dev/null
If both come back inactive and nameserver points straight at the VPC resolver, every lookup on that host is going over the wire.
Five places this could have been stopped
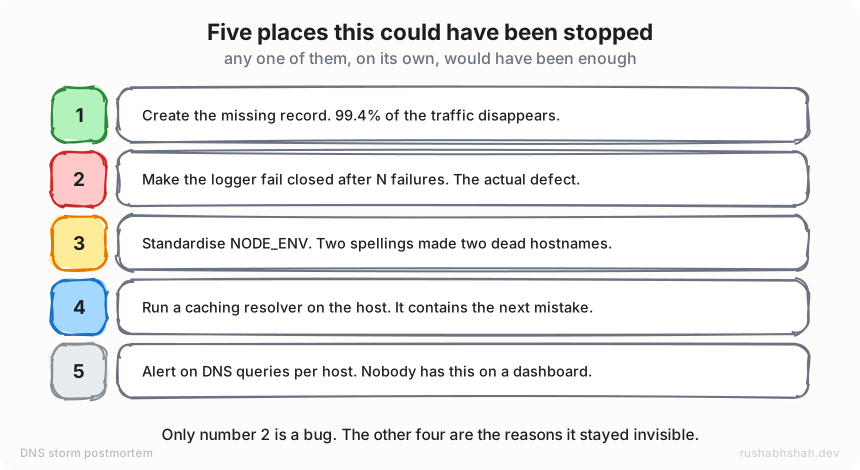
1. Create the record. One DNS entry, and 99.4% of the traffic on that interface disappears. If the environment genuinely has no Elasticsearch, this is the wrong fix and number 2 is the right one.
2. Make the client fail closed. This is the actual defect, and it would have been a defect even with the record in place. A logging transport that cannot resolve its endpoint should give up after a handful of consecutive failures and stay given up, with one loud line about why. Instead it retried forever, silently, because "logging must never crash the app" got implemented as "logging must never stop trying." Those are not the same requirement.
// the shape of the fix, not the diff
let strikes = 0;
transport.on('error', (err) => {
  if (err.code !== 'ENOTFOUND' && err.code !== 'EAI_AGAIN') return;
  if (++strikes < 5) return;
  transport.disable();            // stop resolving, stop reconnecting
  console.error('[logger] disabled after 5 resolution failures:', err.hostname);
});
3. Standardise the environment variable. development on 22 services and dev on two produced two dead hostnames instead of one, and doubled the traffic. Anything that builds a hostname out of an environment variable should validate that variable against a fixed list at boot, not string-concatenate whatever it finds.
4. Run a caching resolver on the host. dnsmasq or unbound in front of the VPC resolver, with negative caching on, turns "46 queries a second forever" into "one query a minute." It does not fix the bug. It contains the next one, which is the point.
5. Alert on DNS queries per host. This is the one I want to argue for hardest, because it is the reason the other four were never needed until they were. Nobody I know graphs DNS query rate per instance. It is not in the default node exporter set, there is no CloudWatch metric, and the failure mode is silent by design. A single alert at, say, 400 packets per second per ENI would have caught this on day one, months before it produced an outage, and the same alert catches every future version of this that anyone will ever write.
What I changed my mind about
I went into this thinking the interesting part would be the missing record. It is not. The missing record is a ticket.
The interesting part is that the failure had no dependency edge to travel along. Everything we build to reason about blast radius, service maps, dependency graphs, tracing, ownership tags, assumes that if A breaks B then A and B are connected. Here they were not connected by anything except being scheduled onto the same virtual machine, and the resource they were fighting over was one nobody had written down as a resource at all.
Shared, undeclared, unmetered, and silently rate limited. DNS is not the only thing on a host that fits that description, and I have started looking for the others: file descriptors, conntrack table entries, the local port range, inode pressure on the log volume. None of those show up on a service map either, and none of them arrive for free with a tracing library, which is the gap between instrumentation and observability that gets glossed over.
If you want the general version of this argument rather than the DNS-shaped one, the Kubernetes v1.37 release notes cover several changes aimed at exactly this class of shared-host resource.
The other thing I would say, more bluntly than I would have a month ago: an error that is caught and logged is not handled. Every one of those 33,030 ENOTFOUND lines was in a catch block that somebody wrote on purpose to make sure logging could never take the app down. It worked. The app never went down because of logging. It went down because of DNS, which is where the failure went once the catch block promised to absorb it forever.
Try it this week
Three things, in ascending order of effort.
Run the tcpdump one-liner from section 3 against one busy box. It takes thirty seconds and you will either learn that your DNS is boring, which is worth knowing, or find something.
Grep your logs for EAI_AGAIN across every service you run and count distinct hostnames. If the answer is more than one, you have a resolver problem wearing a service problem's clothes.
Put a DNS query rate panel on a dashboard. Even without an alert, even just a graph. It is the cheapest possible insurance against a class of incident that is otherwise invisible until it takes something unrelated down at midnight. If writing that query is the part you are unsure about, PromQL is most of what the Prometheus associate exam tests, and this is exactly the kind of panel it makes you practise.
References
- DNS quotas for Amazon EC2, where the 1,024 packets per second per network interface limit is documented
- Amazon Route 53 Resolver, for what the
.2address actually is resolv.conf(5), forsearch,ndots,timeoutandattemptsgetaddrinfo(3), for the full list ofEAI_*return codes- RFC 2308, which defines negative caching and where the negative TTL comes from
- Node.js DNS error codes, if you want the mapping from the C codes to what your application sees
The diagrams in this post are hand-drawn and free to reuse with attribution.
$ dig +short your-own-box
Hopefully, you enjoyed the article! See you in the next one. Until then, happy podding.